National Overview
In 2021, 22.3% of Australians reported speaking a language other than English at home. More than 300 languages are spoken across the country, underscoring how critical language access is for services, government, health, and community support.
Source: Australian Bureau of Statistics, Census 2021
National Top 10 Languages (excluding English)
According to the 2021 Census, the top languages spoken at home are:
Mandarin, Arabic, Vietnamese, Cantonese, Punjabi, Greek, Italian, Filipino / Tagalog, Hindi, Spanish

Between 2016 and 2021, Punjabi grew the fastest, while Greek and Italian declined modestly as established communities aged. Mandarin rose to a clear #1, continuing a trend of growth across Chinese language groups.
Source: Australian Bureau of Statistics, Census 2021
What’s Most Useful for Planning Ahead of the Next Census?
Until the 2026 Census, organisations are relying on state and territory snapshots, still based on the 2021 Census, but with updated reporting tools and maps. These resources help localise planning, especially around English language proficiency (ELP) and identifying where communities may need the most language support.
New South Wales
- Key languages include Mandarin, Arabic, Cantonese, Vietnamese, Hindi.
- NSW health and transcultural resources also provide detailed summaries of household language use and English proficiency.
Source: Transcultural Mental Health Centre
Victoria
- The state’s mapping portal shows top languages by Local Government Area (LGA) and highlights low-ELP languages, supporting decisions about where translated information may have greatest impact.
- Key languages include Mandarin, Vietnamese, Punjabi, Greek, and Italian.
Source: Families, Fairness & Housing Victoria
Queensland
- Government statisticians highlight significant use of Indigenous languages, particularly Yumplatok (Torres Strait Creole) and Kriol, especially in Far North Queensland and the Torres Strait.
Source: Queensland Government Statistician’s Office
Tasmania, Northern Territory, ACT
- ACT and Tasmania: Nepali features prominently, reflecting strong growth.
- Northern Territory: the highest proportion of Aboriginal and Torres Strait Islander people speaking Indigenous languages, including Yumplatok and Kriol.
Various state sources
English Proficiency (ELP): Balancing “Need” vs “Reach”
Nationally, most people either speak only English or report speaking English “very well.” However, ELP varies significantly by language and by location.
For example, Hindi and Filipino/Tagalog rank in the national top 10, but most speakers report high English proficiency, meaning demand for in-language services may be lower. By contrast, Korean and Thai, smaller in overall population, have higher proportions of speakers with limited English, which translates into higher interpreting demand.
State-level maps in Victoria and NSW make these differences visible by LGA, helping organisations tailor language support to both large communities (“reach”) and lower-ELP groups (“need”).
Translationz Service Insights: Languages Most Requested
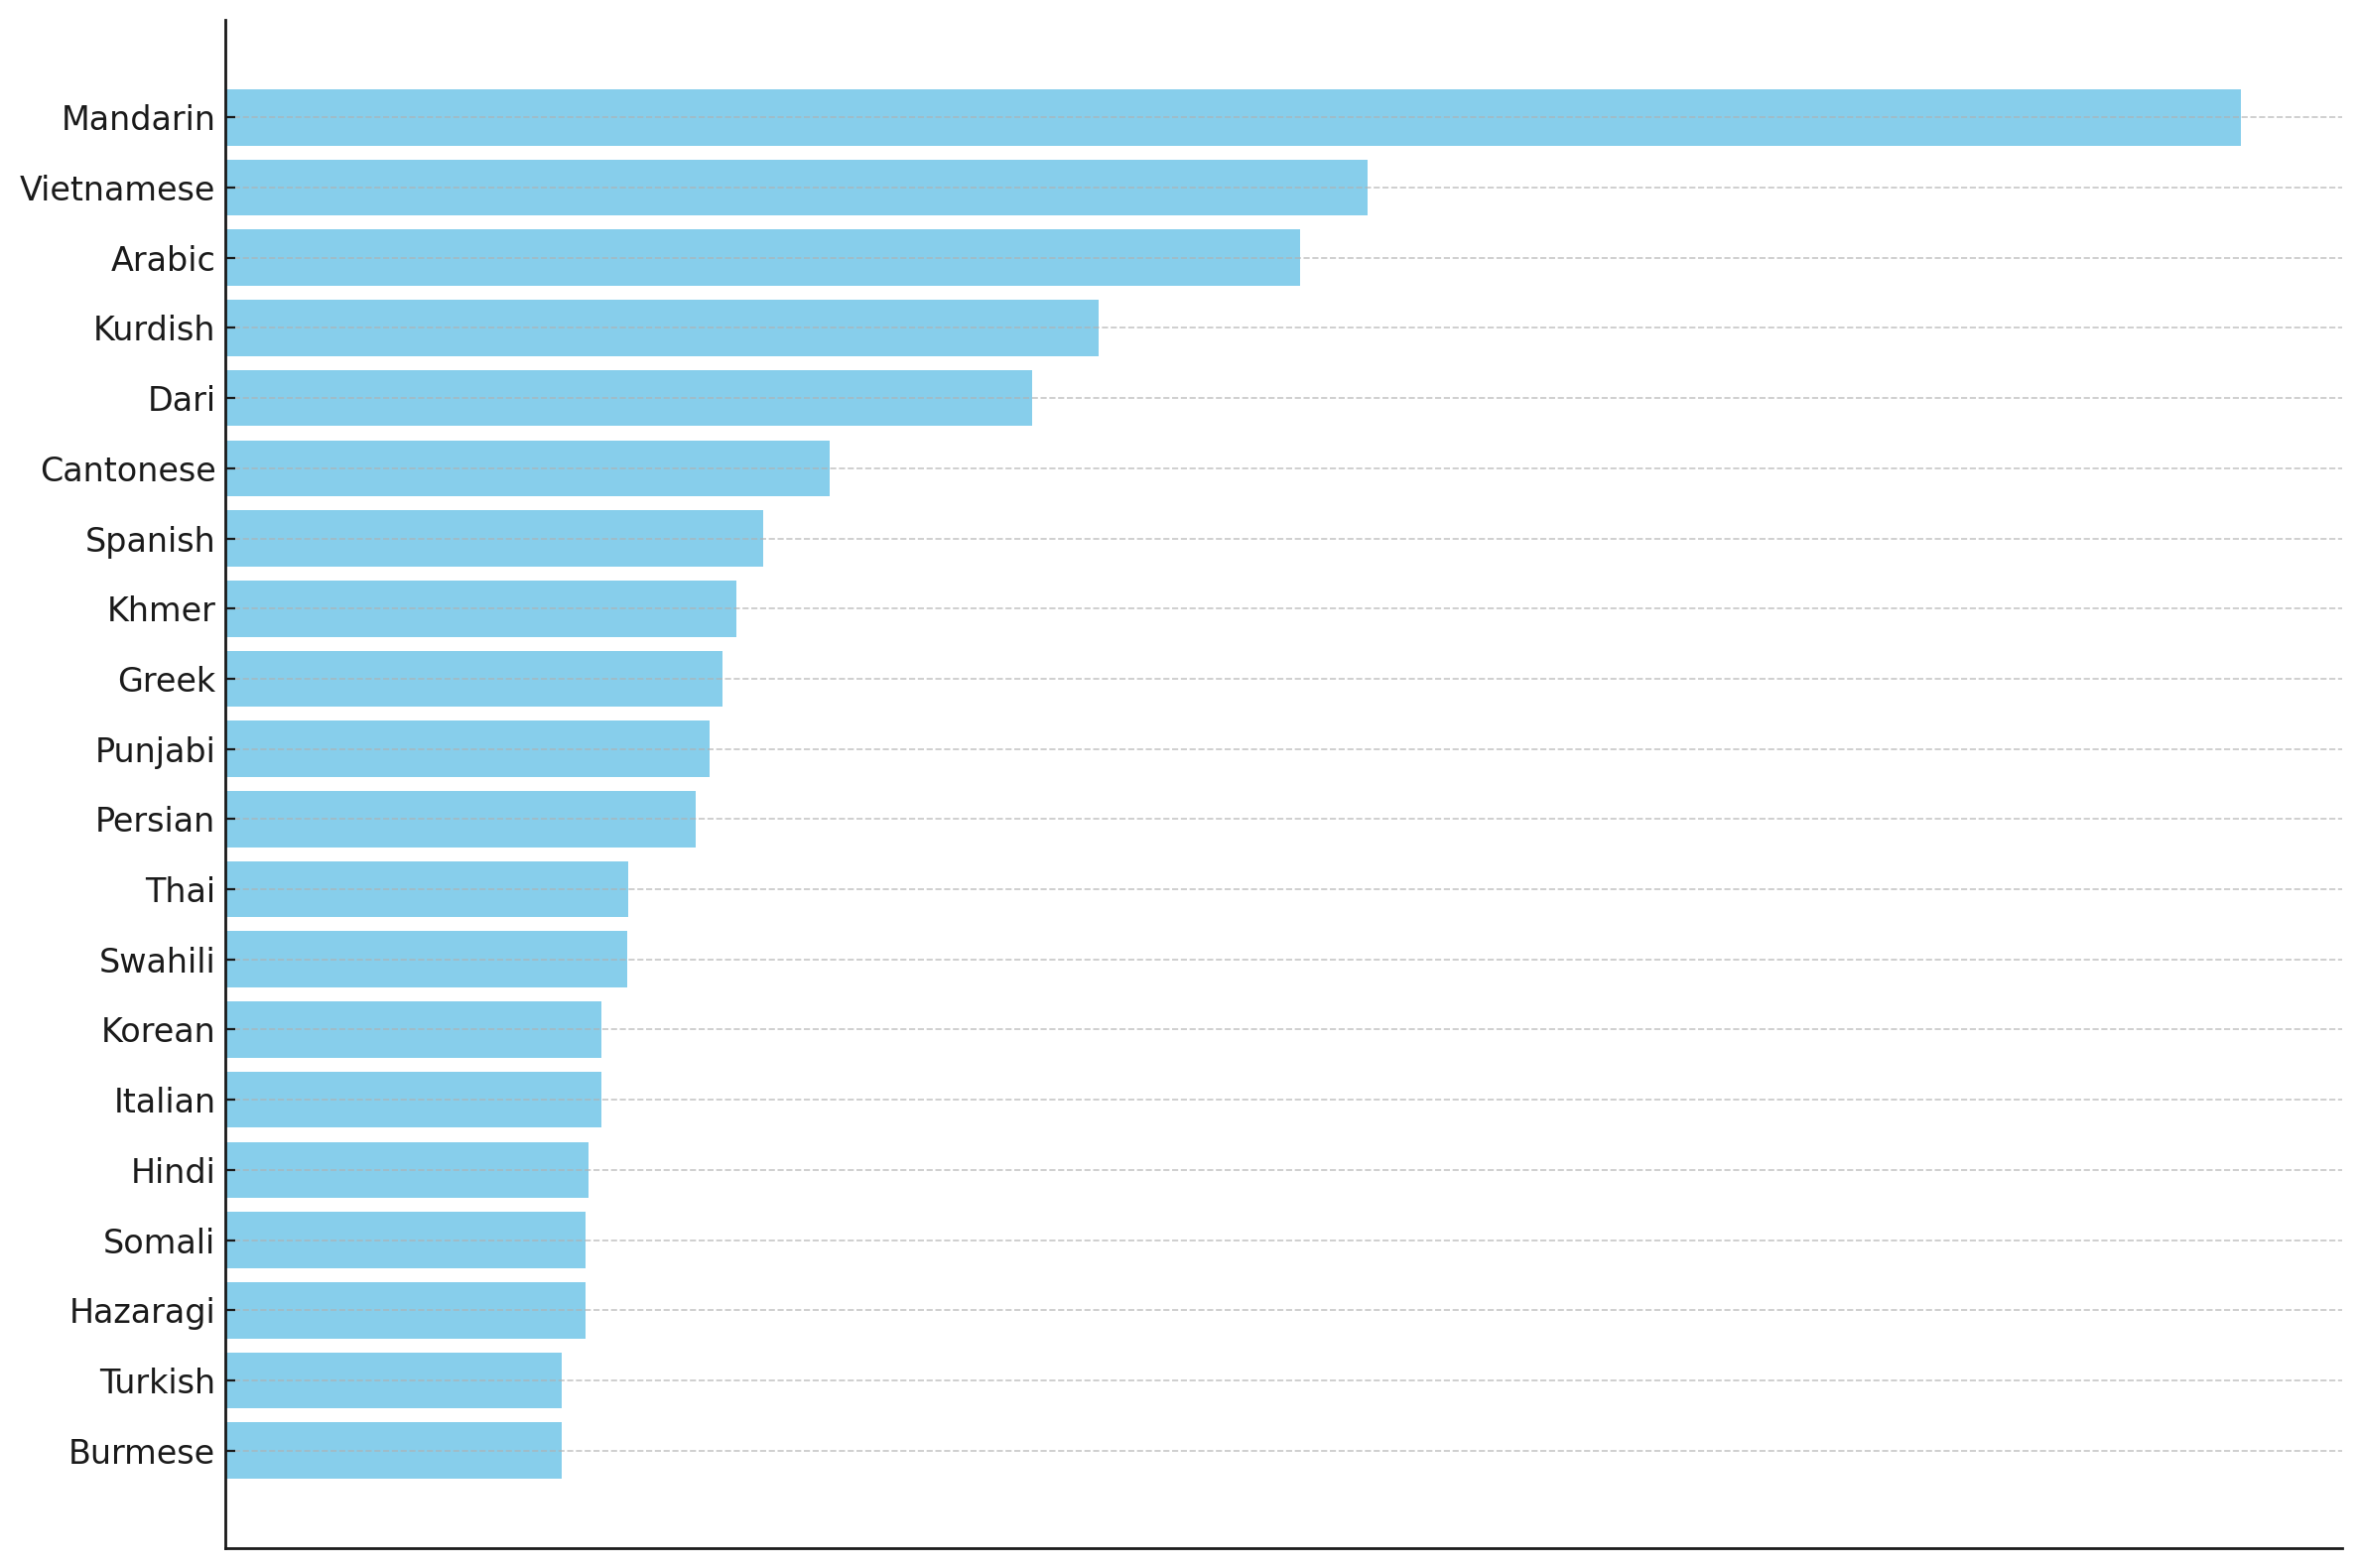
While Census data shows which languages are most commonly spoken at home, service requests tell another story. At Translationz, the most frequently requested languages for Video and Telephone interpreting include:
Mandarin, Vietnamese, Arabic, Kurdish, Dari, Cantonese, Spanish, Khmer, Greek, Punjabi, Persian, Thai, Swahili, Italian, Korean, Hindi, Hazaragi, Somali, Burmese, Turkish
Comparing Census Data with Service Demand
The Census and state data highlight the largest communities—the languages with the most speakers in Australia. But demand for interpreting does not always match population size.
- Census Top 10 overlap: Mandarin, Arabic, Vietnamese, Cantonese, Punjabi, Greek, Italian, Hindi, and Spanish appear in both the Census list and Translationz’ service request list. This shows strong alignment for the biggest communities.
- Emerging languages in requests: Kurdish, Dari, Persian, Hazaragi, Somali, Burmese, Khmer, and Swahili are not in the Census Top 10 but feature heavily in interpreting demand. Many of these are refugee and humanitarian entrant languages or communities with lower average English proficiency.
- Lower demand despite high Census ranking: Filipino/Tagalog is 8th nationally but does not appear often in interpreting requests, likely because most speakers report high English proficiency.
Why the Difference Matters
This contrast highlights an important point:
- Census data = who is here (community size, distribution).
- Service request data = who needs support (language communities with lower English proficiency or greater reliance on in-language services).
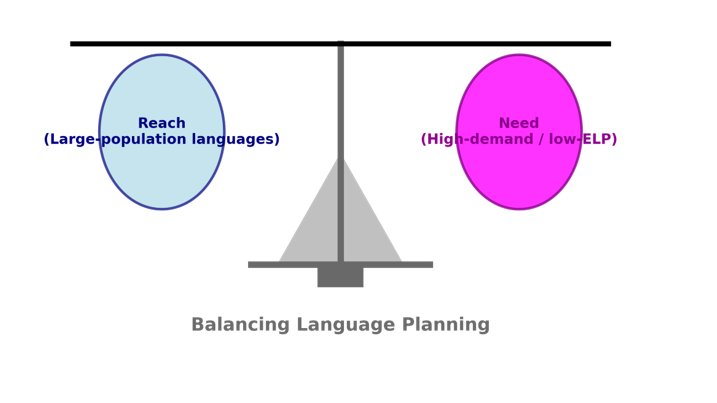
For effective planning, organisations need to use both perspectives:
- Large-population languages for reach.
- High-demand/low-ELP languages for need.
Together, they provide a fuller picture of Australia’s changing language landscape and how to prioritise resources.
Beyond the Census: Where Language Services Matter Most
Australia’s linguistic diversity is continuing to expand and shift. Census data points to Mandarin, Arabic, Vietnamese, Punjabi, and Cantonese as the largest communities, while service insights show strong demand for languages like Kurdish, Dari, Hazaragi, Somali, Burmese, and Swahili that may not rank highly in national totals but are critical for accessibility.
By comparing Census data with real-world service demand, we gain a clearer understanding: the most spoken languages are not always the most requested for support. Balancing both sets of insights ensures that multicultural communication and interpreting services meet both the breadth of Australia’s diversity and the depth of community need.
To learn more about how Translationz helps organisation of all sizes with interpreting and translation needs across Australia, reach out to us or chat with one of our Client Services today by calling us at 03 9034 5299 or email This email address is being protected from spambots. You need JavaScript enabled to view it.